TRUSTED BY 500+ BRANDS


Sales connected to layouts
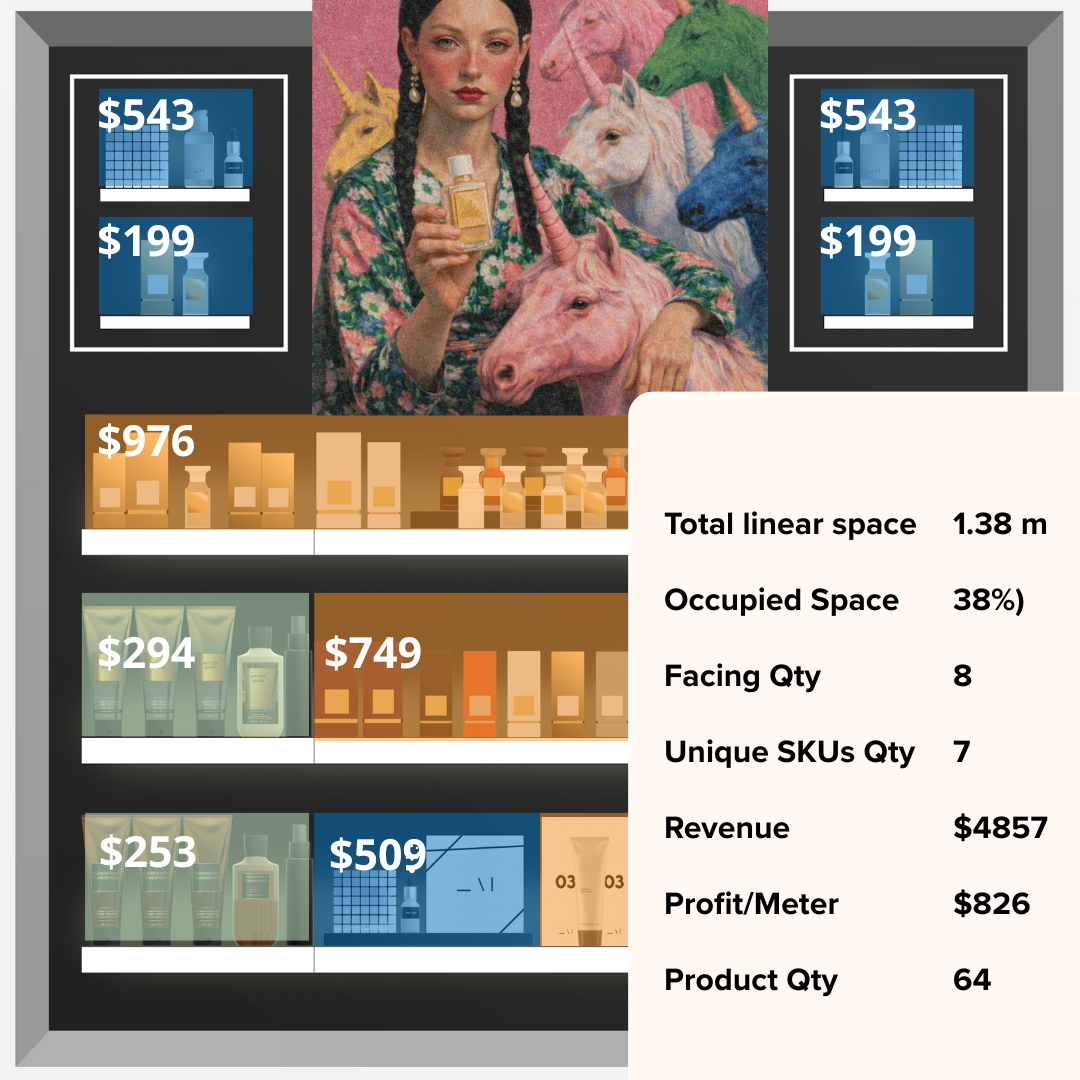
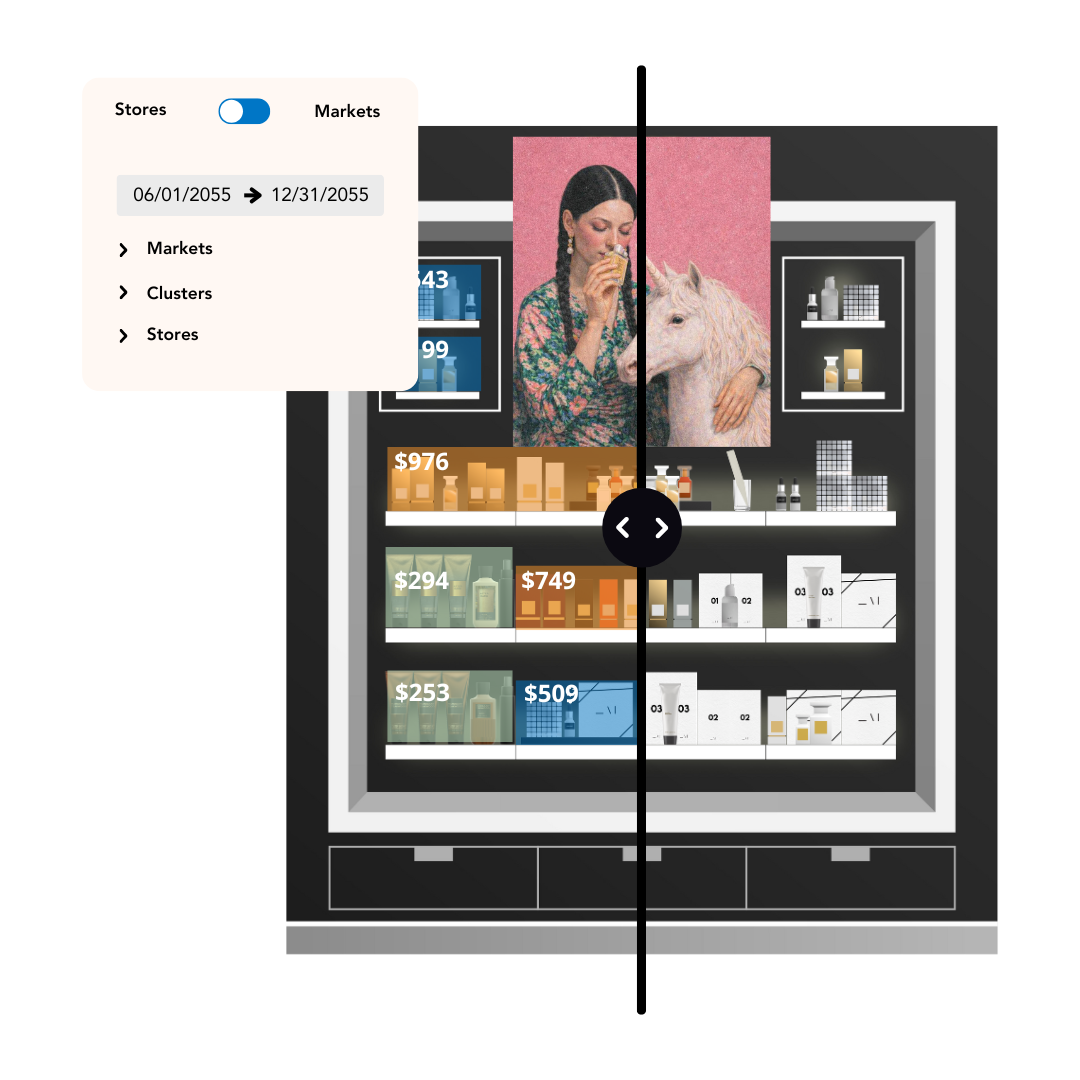
Merchandising decisions shouldn’t live separately from performance. By selecting a period, store, or market and overlaying sales data onto planograms, teams see how space and placement drive revenue per meter, sales velocity, and stock capacity alignment directly where decisions are made.
Powered by heatmaps and A/B testing
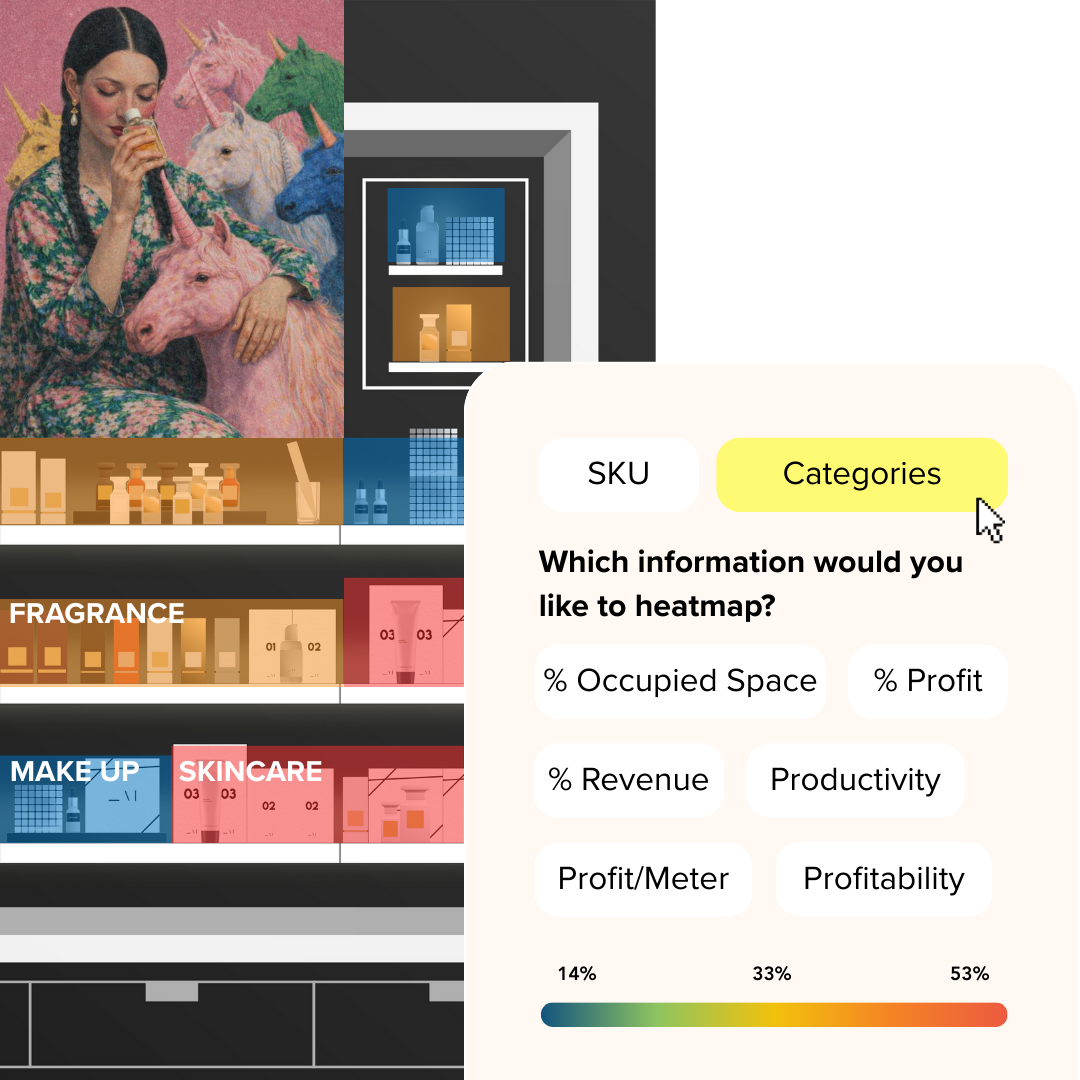
Seeing performance shouldn’t require spreadsheets or guesswork. Heatmaps turn imported performance data into a clear visual layer on layouts, helping teams spot gaps between space allocation and sales contribution, and compare scenarios before rollout.
"IWD allows us to objectively measure the quality and performance of our merchandising and support our decisions with data."

Optimize assortments and layouts by store performance
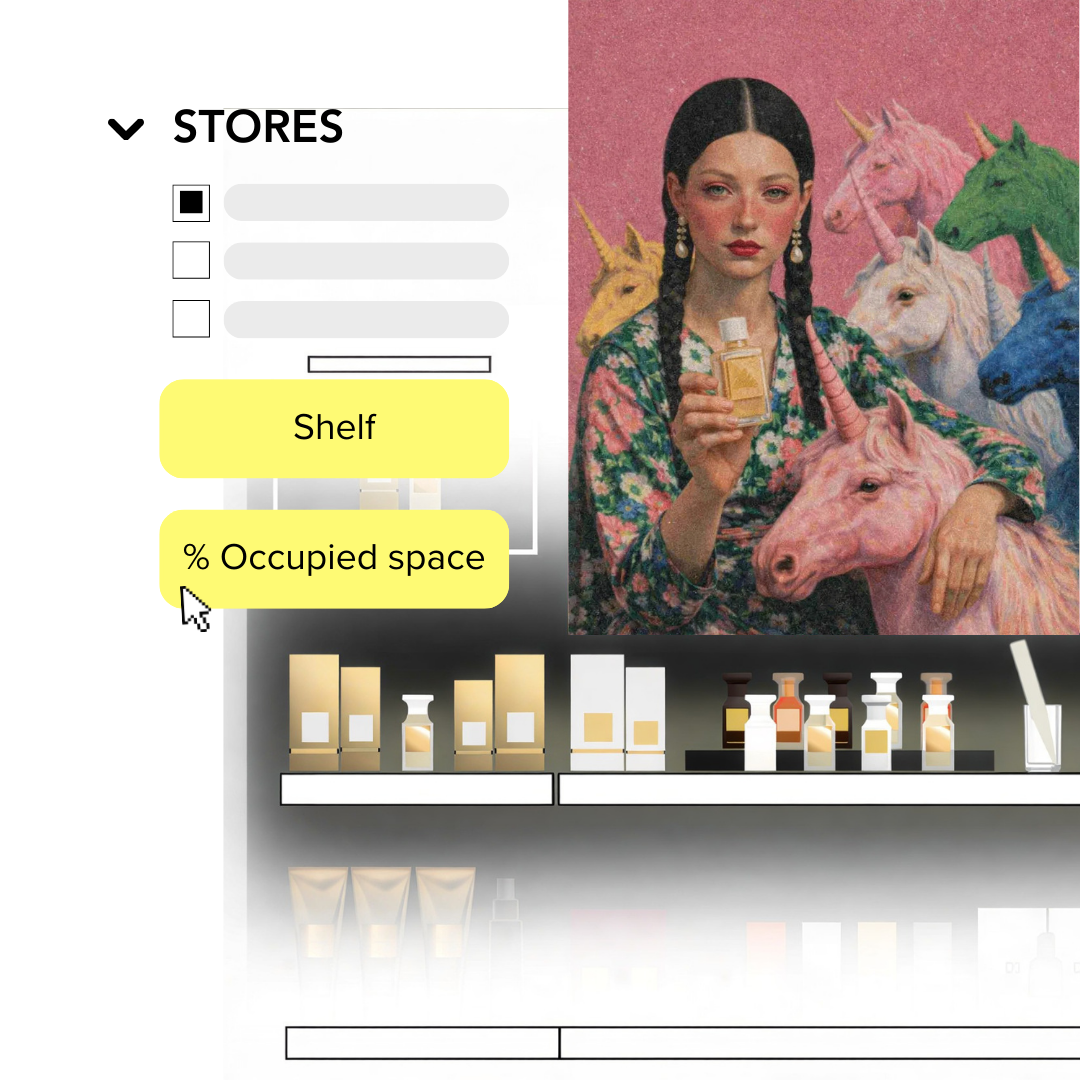
Not all stores perform the same — and layouts shouldn’t either. By analyzing performance by shelf, bay, or category, teams adapt assortments and space allocation based on fast- and slow-moving products and stock coverage, rather than relying on network averages.
Prove ROI to leadership
Merchandising decisions need to stand up to scrutiny. Smart Insights helps teams prove that layouts are aligned with commercial strategy, supported by the right stock, and generating expected revenue. Re-analyzing the same layout over time makes results comparable, measurable, and defensible.

Heatmap

Sales data 2D 3D

Guideline Statistics
News from IWD

RETAIL TRENDS
What Every Boutique Concept Reveals About the Brand Behind It
French Version RETAIL IS NOT DEAD! Retail never stops reinventing itself, surprising and captivating customers. Perhaps the most striking proof of this lies in the fact that, in the aftermath of the p...

RETAIL TRENDS
Minimalism and Quiet Luxury Are on Their Way Out. Now, Gen-Z Is Inspired by Maximalism and Fun Fashion
Gen-Z shopping patterns In a report from the Business of Fashion, Gen-Z’s personal style is different from that of any other generation. While previous ones were defined by magazines, politics, and ce...

RETAIL TRENDS
Shoptalk Spring 2026: What We Saw, Heard, and Learned
The Speed of Product Discovery Today For the first time ever, IWD had a booth at Shoptalk Spring 2026 in Las Vegas and it was a whirlwind! With over 10,000 attendees from across the retail industry pa...