TRUSTED BY 500+ BRANDS


Sales connected to layouts
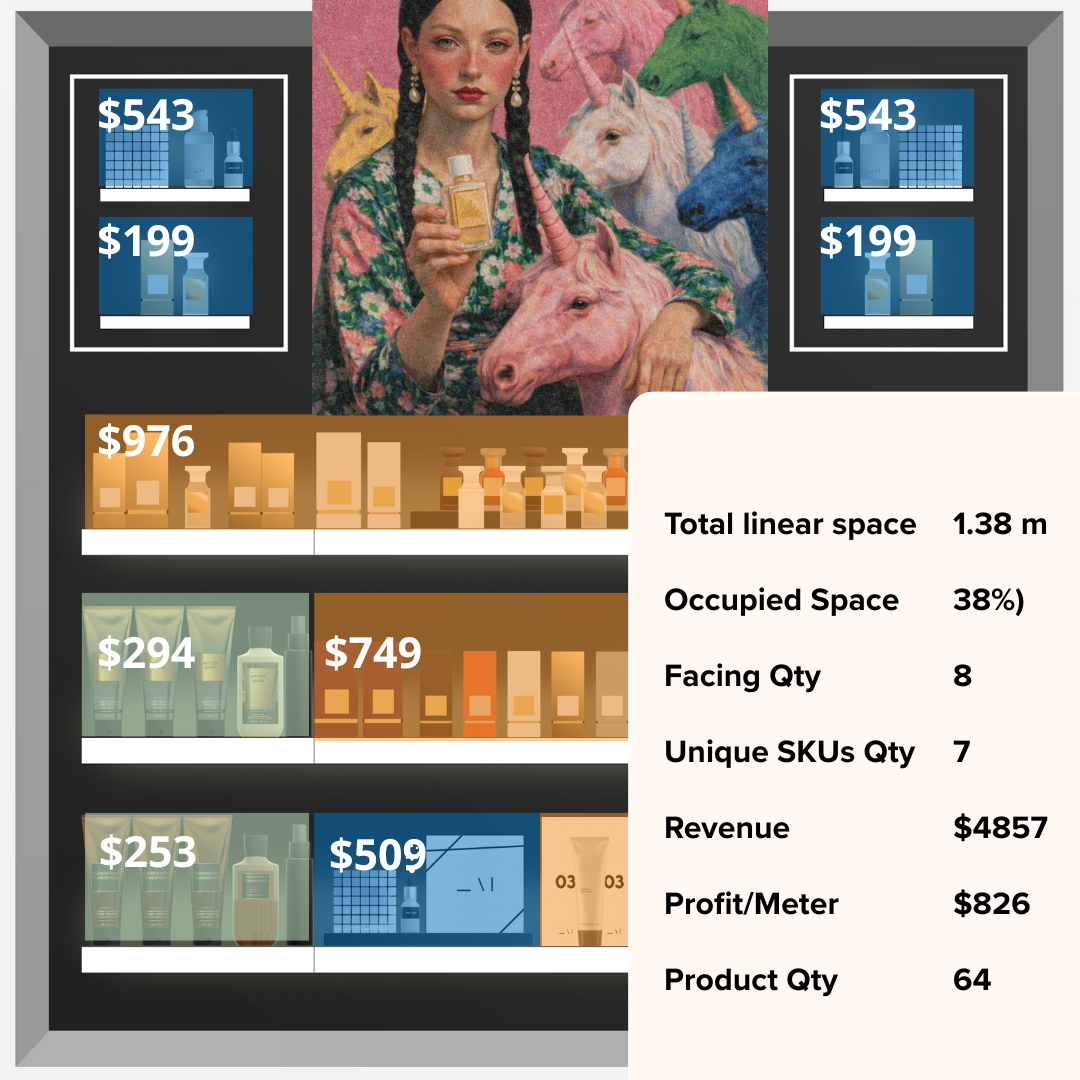
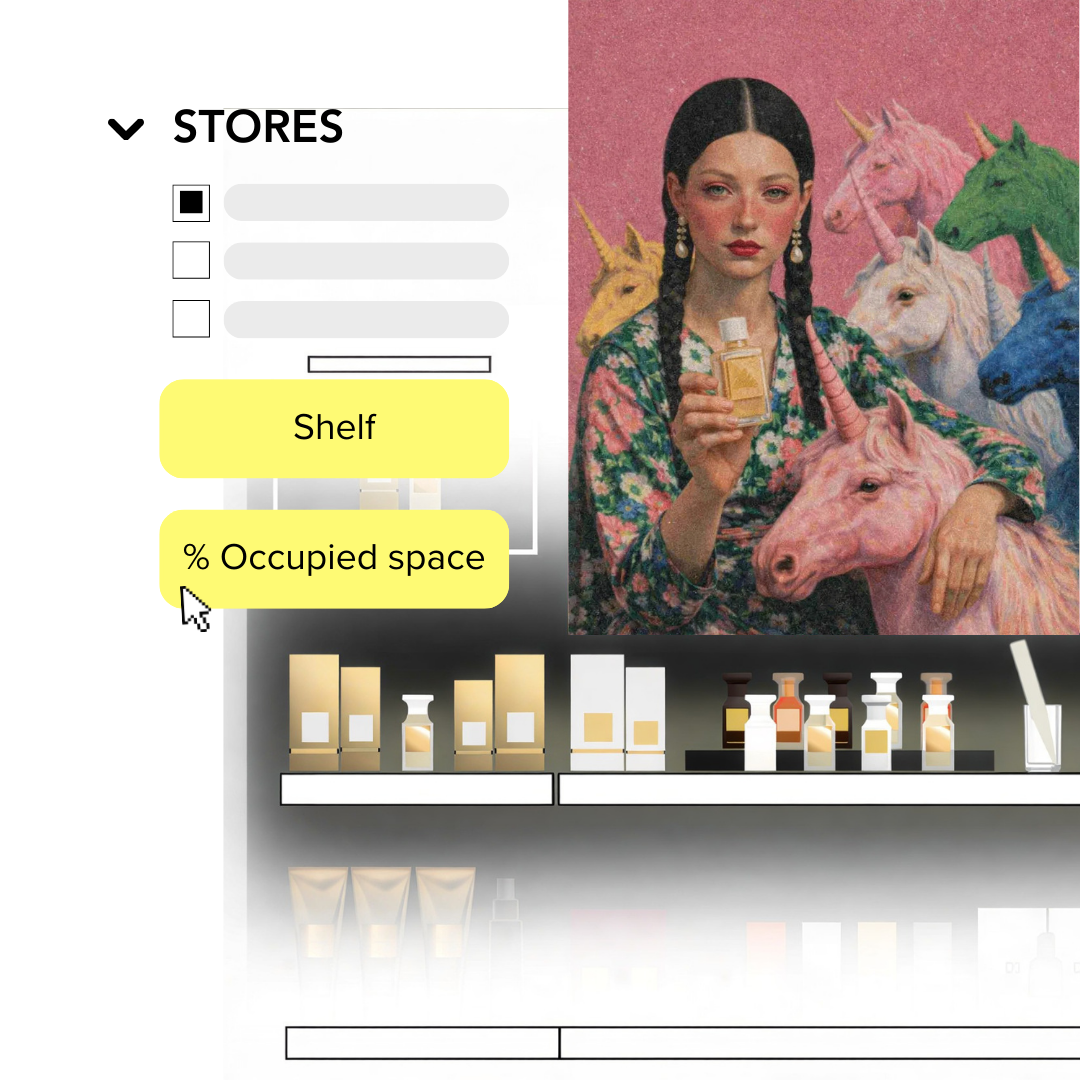
Merchandising decisions shouldn’t live separately from performance. By selecting a period, store, or market and overlaying sales data onto planograms, teams see how space and placement drive revenue per meter, sales velocity, and stock capacity alignment directly where decisions are made.
Powered by heatmaps and A/B testing
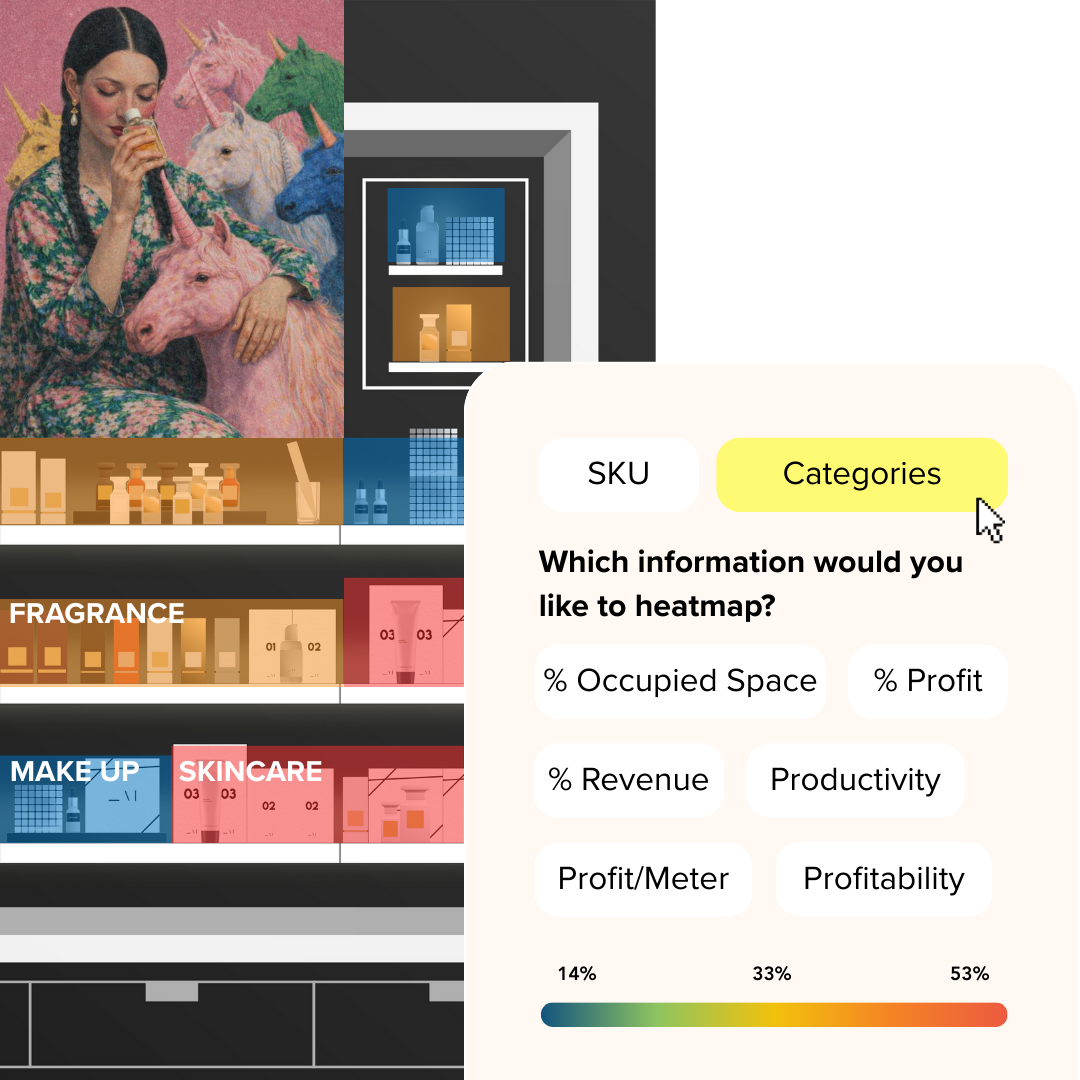
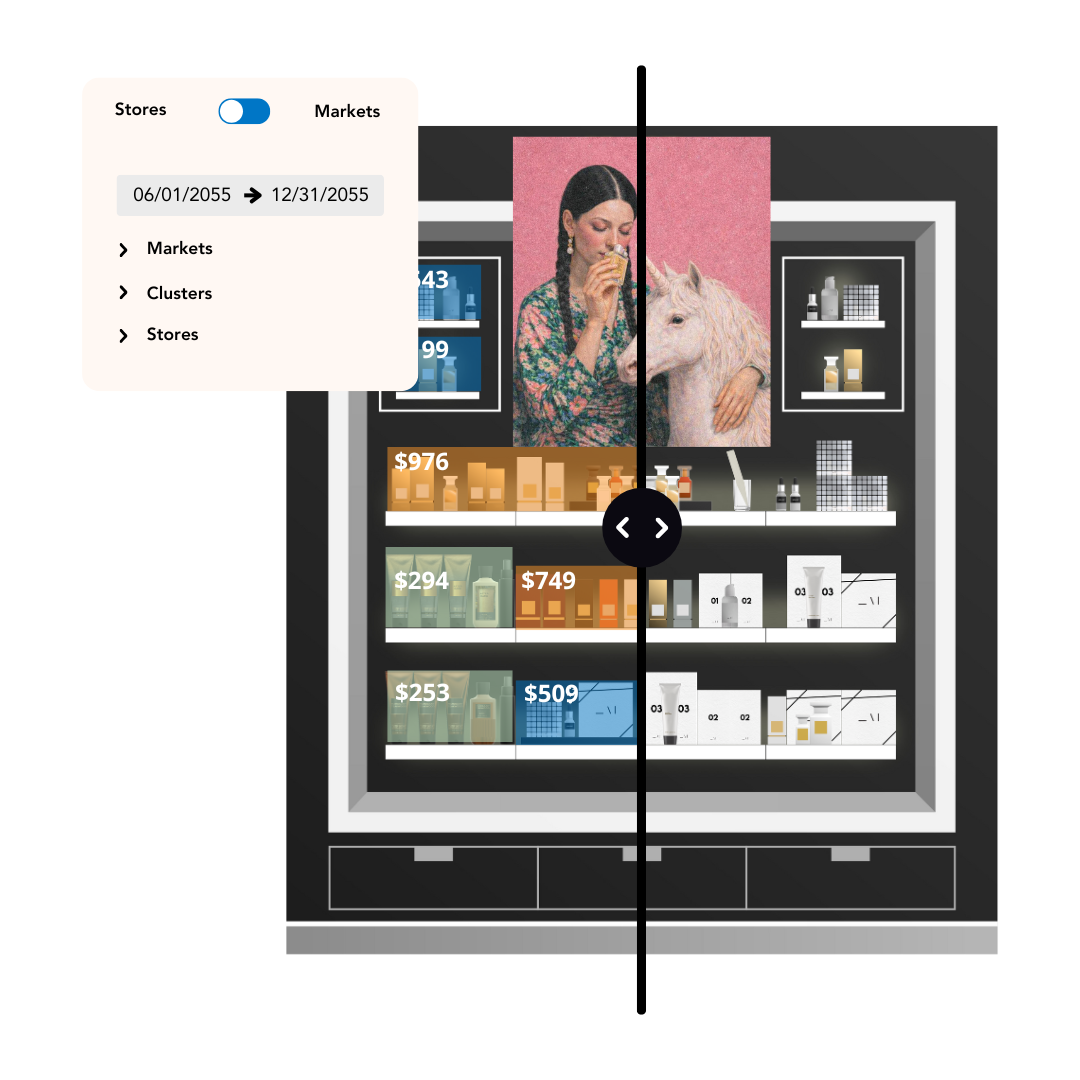
Seeing performance shouldn’t require spreadsheets or guesswork. Heatmaps turn imported performance data into a clear visual layer on layouts, helping teams spot gaps between space allocation and sales contribution, and compare scenarios before rollout.
"IWD allows us to objectively measure the quality and performance of our merchandising and support our decisions with data."

Optimize assortments and layouts by store performance
Not all stores perform the same — and layouts shouldn’t either. By analyzing performance by shelf, bay, or category, teams adapt assortments and space allocation based on fast- and slow-moving products and stock coverage, rather than relying on network averages.
Prove ROI to leadership
Merchandising decisions need to stand up to scrutiny. Smart Insights helps teams prove that layouts are aligned with commercial strategy, supported by the right stock, and generating expected revenue. Re-analyzing the same layout over time makes results comparable, measurable, and defensible.

Heatmap

Sales data 2D

Guideline Statistics
News from IWD

RETAIL TRENDS
How Top Visual Merchandisers Stay Inspired and Ready for 2026
How do you keep your creative brain fresh when collections keep rolling out, marketing briefs speed up, and you still have to surprise, delight, and innovate? To find out, we asked eight leading retai...

RETAIL TRENDS
Changing spaces: How to make retail spaces work for seasonal brands
Alongside stock and staffing costs, real estate (and all the expenses that come with it) is one of the most significant investments in running a physical retail business. Securing the right location i...

RETAIL TRENDS
The TikTok Effect: How Viral Trends Are Changing Visual Merchandising
The Speed of Product Discovery Today The evolution of social media has put retail cycles into overdrive. TikTok, in particular, has become a powerful launchpad for products, with over 1.04 billion act...